Understanding USDY’s Unique Position in Crypto
Ondo US Dollar Yield sits in an interesting spot—it’s not quite a stablecoin, not quite a traditional investment token. Instead, USDY represents a tokenized note backed by short-term U.S. Treasuries and high-quality bank deposits, bringing real-world assets into the DeFi space. Think of it as a digital wrapper around institutional-grade fixed income.
What makes it stand out? For starters, you can mint and redeem USDY daily if you’re outside the U.S., giving it stablecoin-like liquidity. The product maintains roughly 3% over-collateralization as a safety buffer, and its governance structure includes bankruptcy remote protections—essentially institutional guardrails built into the design. With integration across seven to eight blockchains and a total value locked in the hundreds of millions, USDY offers something that traditional stablecoins don’t: yield. Currently, that sits around 4-5% APY, making it attractive for those who want their dollar-equivalent tokens to actually earn something.
Recent moves have strengthened USDY’s market position. Its launch on the Sei Network brought tokenized Treasury Bills to that high-speed Layer-1 for the first time, opening doors for institutional users who need fast settlement. Meanwhile, partnerships with platforms like ICRYPEX are making it easier to onboard fiat and use USDY in real payment scenarios and treasury management. These aren’t just technical upgrades—they’re steps that build confidence and reduce the likelihood of sudden downside shocks.
Current Price Action and What the Charts Say
Right now, USDY is trading around $1.1187 against USDT, up about 0.038 over the past day. It’s not explosive movement, but that’s kind of the point—this token is designed to stay anchored near its peg while delivering yield, not to swing like an altcoin.
Looking at the technical picture, things are mixed. Short-term moving averages—the 5-day and 10-day—are showing mild bullishness, suggesting recent momentum is slightly positive. But zoom out to the 50-, 100-, and 200-day averages, and the longer-term signals lean bearish or neutral at best. Momentum oscillators like the Stochastic and Stochastic RSI hint at some upward pressure, though we’re nowhere near overbought territory. The 14-period RSI sits in neutral ground, and volatility measures like ATR remain low—exactly what you’d expect from something that behaves more like a stable asset than a speculative token.
Support and resistance levels paint a tight picture. The immediate floor sits around $1.1050 to $1.11, with stronger support near $1.0950 if things turn sour. On the flip side, resistance clusters around $1.1150, with psychological barriers at $1.12 and a stretch target near $1.1250 if buying interest picks up. Volume is thin, though, so any meaningful move—up or down—would need a real catalyst or a surge in trading activity to break through these levels.
What the Chart Patterns Reveal
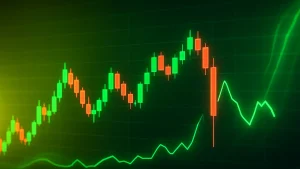
The chart shows USDY locked in a horizontal consolidation band between roughly $1.10 and $1.12. It’s tested both ends several times without breaking through convincingly, which tells us traders are in a holding pattern. Given the yieldcoin structure, we shouldn’t expect wild swings unless something external forces the issue—maybe a sharp move in Treasury yields, new regulatory pressure, or a broader flight to safety in crypto markets.
Price Scenarios and Risk Factors Ahead
So where does USDY go from here? Let’s walk through a few plausible paths.
In the base case, we’re looking at more of the same—consolidation between $1.10 and $1.12 over the next week or two. If volume ticks up modestly, we might see a test of $1.1250 resistance. If support fails around $1.10, the next stop would be $1.0950, and possibly a dip toward $1.09 in a weaker scenario.
The bullish breakout would come if demand for real-world asset tokens heats up, institutional money flows in, or crypto markets turn defensive and capital rotates toward yield-bearing dollar assets. In that case, USDY could push above $1.1250 and hold there, targeting $1.13 to $1.15 over the next four to six weeks.
On the bearish side, a spike in U.S. Treasury yields or regulatory crackdowns—especially outside the U.S.—could pressure support. We’d be looking at a move toward $1.08 or $1.09, though USDY’s collateral structure makes deeper drops unlikely unless liquidity completely dries up.
Some automated forecasting models suggest an average annual price around $1.28, with extreme bounds ranging from $0.77 to $3.06 over the full year. Take those wide bands with a grain of salt—they’re more about defining outer limits than predicting likely outcomes.
Key Risks and What to Watch
Even with its solid backing, USDY isn’t risk-free. Regulatory shifts are the big wildcard, especially around tokenized securities and stablecoin rules in non-U.S. markets. Collateral risk is another factor—if short-term Treasuries face liquidity stress or yield curve weirdness, even high-quality instruments can move in unexpected ways. And with low trading volume, any negative catalyst can amplify downside quickly.
On the upside, broader adoption in DeFi—think payments, collateral for lending, or DAO treasury management—could drive sustained demand. More network integrations and easier fiat onramps would reinforce that trend.
Here’s what to keep an eye on:
– A daily close above $1.1250 with rising volume—that would signal a breakout attempt.
– A break below $1.10, especially if crypto markets turn broadly risk-off, opening the door to $1.0950 or lower.
– Moves in U.S. Treasury yields—sharp increases could squeeze USDY’s underlying yield spread and compress its net asset value.
– Any regulatory news on tokenized securities or stablecoin frameworks, particularly in Europe and Asia.
Bottom line: USDY looks technically stable for now, anchored by its real-world asset backing and steady yield. Big moves are possible, but they’ll need a push from outside forces. For the moment, cautious optimism seems like the right stance.