Market Fundamentals and Recent Developments
Venice Token (VVV) is currently trading around $1.1469, showing a modest 24-hour gain of roughly 4.7%. The token has been making waves lately thanks to some significant changes in how it operates and what it offers.
The big shift came in August 2025 with the launch of DIEM, which fundamentally changed VVV’s staking model. Now when you lock up VVV tokens, you earn tokenized AI compute credits instead of more VVV. At the same time, the team cut annual emissions from 14 million to 10 million tokens—a move that’s clearly affecting both supply dynamics and investor sentiment. Venice hasn’t been sitting still on the product side either. They’ve rolled out new AI models like Mistral Small 3.1 24B, expanded context windows, and enhanced their API offerings. These improvements are drawing attention from developers and AI users who value private, uncensored inference services.
The technical indicators suggest VVV may be oversold on shorter timeframes, hinting that the recent downward pressure could be easing. That said, the token hasn’t been immune to broader market headwinds. Privacy and AI regulations are creating uncertainty, and institutional money has been flowing away from smaller altcoins. Over the past month, VVV has actually underperformed many of its peers in the AI token space, with trading volume remaining relatively thin.
Technical Picture and Key Price Levels
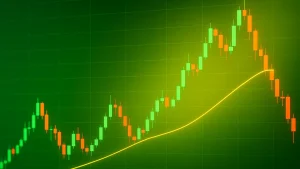
The charts paint a cautious picture right now. VVV is trading below essentially all of its major moving averages—the 5, 10, 20, 50, 100, and 200-period lines on both simple and exponential calculations. These averages are stacked in a downward cascade, which is typically a bearish signal. The oscillators tell a similar story: RSI sits in the mid-40s, Williams %R shows oversold conditions, and while StochRSI is starting to show signs of bottoming, the MACD hasn’t confirmed any bullish crossover yet on higher timeframes.
On the support side, traders are watching $1.10 as the first line of defense, with stronger support levels at $1.07 and $1.00–$1.05. These zones align with previous volume clusters and historical price lows. Resistance starts right around $1.15—just above where we’re trading now—and extends up to $1.21–$1.25 where you’ll find the 7-day moving average and key Fibonacci retracement levels converging. If VVV can’t push through this resistance zone convincingly, we’re likely to see another test of support levels below.
What’s Next: Three Scenarios to Watch
The Bullish Path
If VVV can close above $1.15 on a daily timeframe with solid volume backing it up, and if we see the MACD flash a positive crossover, then a move toward $1.25–$1.30 becomes realistic. Breaking above $1.30 with conviction could open the door to $1.40, where longer-term moving averages and previous supply zones sit.
The Sideways Grind
More likely in the near term, VVV could trade in a range between $1.05 and $1.20 as the market waits for more concrete data. Traders will be watching for DIEM usage statistics, API engagement numbers, or news like new exchange listings. In this scenario, the $1.07–$1.10 zone becomes a critical accumulation area, while losing $1.05 would be a warning sign.
The Bearish Breakdown
If selling pressure picks up and VVV drops below $1.05 on heavy volume—especially if the broader altcoin market weakens—then we could see a slide toward $0.90–$1.00. A break below that level might target $0.80, though such a move would likely require either a macro shock or token-specific bad news.
Practical Takeaways for Traders and Holders
If you’re trading VVV short-term, there are opportunities to scalp resistance rejections around $1.15 and catch bounces from support levels. Given the volatility, tight stop-losses are essential. Daily charts will give you more reliable signals than trying to trade intraday movements.
For those holding long-term, the real question is adoption. Keep an eye on how much DIEM is actually being used, how much VVV is being locked up on-chain, and whether Venice continues improving its model offerings. These metrics will determine whether the token’s utility can support higher valuations over time. The reduction in token emissions and deflationary mechanics should also help with supply pressure as we move through 2026, assuming demand holds or grows.