Why ZetaChain Is Making Waves Despite Price Struggles
ZetaChain has quietly been building something interesting. The network’s .zeta domain service just crossed 160,000 registrations, putting it up there with some of the bigger Web3 identity projects. Think of it like getting a readable name instead of that mess of letters and numbers for your wallet—except this one works across Bitcoin, Ethereum, Solana, and other chains. It’s the kind of thing that makes crypto feel a little less intimidating for regular users.
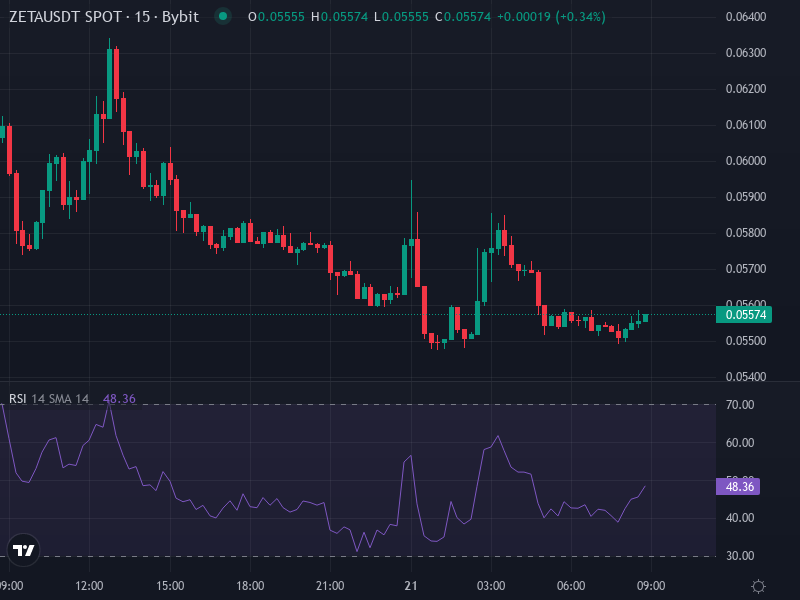
The network itself has been growing steadily. More wallets are active, more projects are integrating, and the cross-chain vision seems to be resonating. But here’s the thing: none of that excitement is showing up in the price right now. ZETA is trading around $0.05548, down nearly 8% in just 24 hours. The charts look rough, and traders are nervous.
What the Technical Picture Really Looks Like
Let’s talk about what the numbers are actually saying. ZETA is sitting below all its major moving averages—the 20-day, 50-day, and 100-day exponential moving averages are all acting as a ceiling right now. That’s textbook bearish setup. When a token trades under these levels, it means sellers have been in control for a while, and buyers haven’t found a reason to step back in yet.
The Relative Strength Index, which measures whether something is overbought or oversold, is hovering around 33.9. That’s getting close to oversold territory—the zone where bargain hunters sometimes start sniffing around—but it’s not quite there yet. And honestly, oversold doesn’t always mean a bounce is coming. Sometimes it just means more pain ahead.
The MACD indicator, another tool traders watch for momentum shifts, is still negative. No bullish crossover in sight. Volatility is also running high, with the Average True Range showing daily swings of around 10-11% of the token’s price. Translation: expect whipsaw moves that can shake out weak hands on either side.
The Levels That Matter Right Now
If you’re watching ZETA, here’s what to keep your eyes on. Resistance—the price ceiling where sellers have been stepping in—sits between $0.058 and $0.060. The token has tried and failed to break through this zone multiple times recently. Until it clears that hurdle with real volume behind it, bulls don’t have much of a case.
On the downside, support is hanging around $0.050. If that level gives way, the next stop could be somewhere near $0.047. Looking at Fibonacci retracement levels from the bigger picture—back when ZETA was trading around $0.20—we can see that the token has already blown through several key retracement points without holding. The nearest upside Fib zones are distant now, somewhere in the $0.060 to $0.065 range, which lines up with the resistance we just talked about.
Where This Could Go Next
So what’s the play here? Honestly, it depends on what kind of trader you are and what your risk tolerance looks like. Let’s break down the two most likely scenarios.
If the Bears Stay in Control
In the bearish case—which the charts currently favor—ZETA could easily retest that $0.050 support level. If it breaks, we’re likely headed down to the $0.045 to $0.047 range. This would especially be true if the broader crypto market catches a cold or if Bitcoin stumbles. Altcoins like ZETA tend to get hit harder when risk appetite dries up.
If Bulls Stage a Comeback
For a real reversal to happen, ZETA needs to reclaim that $0.058 to $0.060 zone with conviction. That means volume—lots of it. A breakout on weak volume is just a fakeout waiting to happen. If it does manage to push through, the next upside targets would be around $0.070 to $0.075. But for that to stick, we’d probably need a catalyst: maybe a major partnership announcement, a surge in network usage, or just a broader crypto rally lifting all boats.
The Wild Cards
A few things could throw a wrench in either scenario. Macro conditions matter—if the Fed signals more rate hikes or if stocks tank, crypto usually follows. On the flip side, any technical hiccups or security issues on the ZetaChain network could tank confidence fast. And then there’s the question of whether all this ecosystem growth—the domains, the integrations, the cross-chain activity—actually translates into sustained demand for the ZETA token. That’s still an open question.
Bottom Line: What to Watch
Short-term, expect ZETA to chop around between $0.050 and $0.060 unless something changes. The trend is down, the indicators are weak, and there’s no obvious catalyst on the horizon. Over the next one to three months, the bearish case points to a potential slide toward $0.045 or lower, while the bullish scenario—which requires breaking resistance and building momentum—could see a push back toward $0.070 or higher.
For now, the smart money seems to be sitting on the sidelines or playing tight ranges. If you’re thinking about jumping in, wait for confirmation. Either a decisive break above $0.060 with volume, or a solid hold at $0.050 with signs of accumulation. Until then, this one’s still finding its footing.