Market Context & What’s Driving ZIGChain
ZIGChain has been getting attention lately as a Real-World Assets (RWA) project that’s trying to do things differently. The platform recently launched its Layer-1 mainnet after evolving from Zignaly, and it’s brought some interesting features to the table—shariah-compliant mechanisms and institutional-grade compliance infrastructure that seem designed to appeal to a broader, more conservative base of capital.
Partnerships are giving the project some legitimacy too. Working with firms like Apex Group, which manages trillions in assets, and being connected to Nasdaq-listed SEGG Media adds a layer of credibility that many newer tokens lack. These aren’t just flashy announcements—they suggest ZIGChain is building the kind of institutional relationships that could actually translate into sustained demand over time, assuming they execute well.
But the macro environment remains tricky. Interest rate uncertainty and regulatory fog continue to hang over the entire crypto space. When fundamental developments like ZIG’s RWA Lending Engine and Shariah Certification align with clearer regulatory frameworks, that’s when you tend to see more durable price action rather than just speculative pumps and dumps.
What the Charts Are Telling Us Right Now
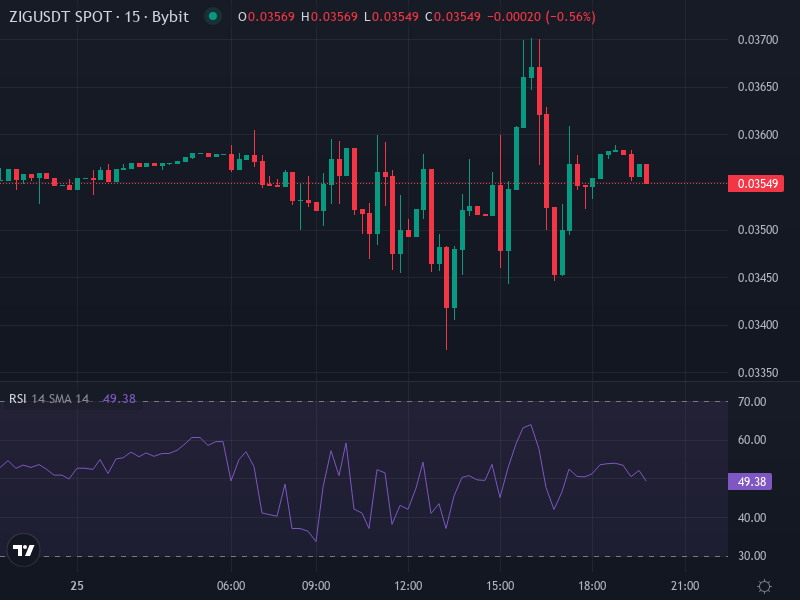
At around $0.03560, ZIG is sitting in an uncomfortable spot technically. The 4-hour charts show most of the moving averages—both short-term EMAs and longer SMAs—sitting above the current price. That’s textbook resistance and suggests there isn’t much conviction behind any upward push right now. Oscillators aren’t helping either: several are flashing “sell” signals, indicating weak momentum.
The daily timeframe offers a slightly more mixed picture. RSI is floating in neutral territory—not oversold, not overbought—which means there’s room to move in either direction. That’s both good and bad. Good because there’s upside potential without hitting immediate resistance from overbought conditions. Bad because there’s no clear bottoming signal either. Moving averages on the daily remain bearish, meaning any recovery will need to fight through multiple resistance zones before sentiment really shifts.
Volatility is relatively muted, which suggests any significant move will likely need either a spike in volume or a meaningful external catalyst—whether that’s a partnership announcement, a listing on a major exchange, or broader market improvement.
Key Levels to Watch
On the upside, the immediate hurdle sits between $0.04 and $0.05. This zone lines up with prior moving averages and represents where sellers have previously shown up. Break through that decisively with volume, and $0.06 becomes the next target. Historically, $0.06 has acted as a tougher ceiling, so clearing it would be a meaningful technical shift.
On the downside, support is forming around $0.03 to $0.0325. If that breaks, the next meaningful level is down near $0.02. Losing $0.03 could trigger some stop-loss cascades and bring more aggressive selling. Holding above $0.03 and reclaiming $0.04 would be the first sign that buyers are regaining control.
Price Scenarios and What Could Happen Next
Let’s break this down into three realistic scenarios based on what the charts and fundamentals are showing.
Base Case: Slow Grind Higher
If ZIG can hold the $0.03 level and the broader market stabilizes—think easing macro conditions, clearer crypto regulation—there’s a reasonable path back to the $0.045–$0.06 range over the next few weeks or months. This isn’t a moon scenario. It’s a gradual climb that requires volume to pick up and for the token to clear those moving average clusters sitting near $0.04. It’s possible, but it won’t be easy or fast.
Bull Case: Real Momentum Returns
For a more aggressive upside move, ZIG needs to decisively break $0.06 with strong volume. If that happens, $0.08 and even $0.10 come into view. This scenario depends on several things lining up: oscillators like RSI pushing into the 60-70 range, MACD crossing into positive territory, and short-term moving averages flipping above longer-term ones. It also likely requires positive fundamental catalysts—new partnerships, increased protocol usage, or a broader risk-on sentiment in crypto.
Bear Case: Further Downside
On the flip side, if $0.03 fails to hold, the door opens to $0.02 or lower. This becomes more likely if macro conditions worsen, regulatory crackdowns intensify, or liquidity dries up. With so many moving averages above current price, there’s structural resistance that could keep pressure on the downside. If RSI drops below 40 with accelerating volume, or if price breaks and holds under $0.03, that confirms the bearish trend is intact.
Technical Triggers to Watch
Traders and investors should keep an eye on a few key signals. A daily close above $0.04 would be the first sign of strength. Pair that with a MACD crossover to the upside and RSI moving consistently above 50, and you’ve got confirmation that momentum is shifting. Volume is critical here—any bullish price move without volume is suspect.
On the bearish side, watch for RSI dropping below 40 with heavy sell volume, or a clean break below $0.03 that holds. Those would be clear signals that the downside pressure is intensifying.
Strategic Takeaways
The current price of $0.03560 is nowhere near the bullish long-term forecasts floating around, which often assume everything goes right—institutional adoption accelerates, real-world asset inflows grow, regulatory clarity arrives, and tokenomics (staking, governance, gas fees) reduce sell pressure. Those forecasts aren’t necessarily wrong, but they’re betting on a lot of favorable conditions aligning.
ZIGChain has a compelling story, especially for investors thinking in quarters, not weeks. The fundamentals—partnerships, compliance infrastructure, RWA focus—give it a differentiated narrative in a crowded space. But in the short to medium term, the path forward is narrow. Price needs to reclaim $0.04–$0.05, build real momentum, and align technical and fundamental catalysts to sustain a turnaround.
If the fundamental story stalls or broader market sentiment sours, downside risk to $0.02 is very much in play. This isn’t a buy-and-forget scenario yet. It’s one that requires patience, close monitoring of key levels, and an honest assessment of whether the project can deliver on its ambitious roadmap.