
What’s Happening with Zilliqa Right Now
Zilliqa recently rolled out its biggest upgrade yet—Zilliqa 2.0. The new protocol brings full Ethereum compatibility, a more efficient proof-of-stake system, and modular “x-shards” that promise better scalability. On paper, these changes should attract more developers and institutional players by making the network faster, more flexible, and easier to integrate with other blockchains.
The team’s also pushing hard into regulated DeFi and tokenized real-world assets, which could be a smart play as crypto matures and traditional finance starts paying attention. New staking options and cross-chain bridges round out the upgrade. All of this points to a project that’s evolving in the right direction.
But here’s the thing—the market hasn’t really responded yet. While the fundamentals look stronger, the price is stuck in a rut, barely moving despite all these improvements. That disconnect between what the tech promises and what traders are actually willing to pay is the story right now.
Breaking Down the Charts
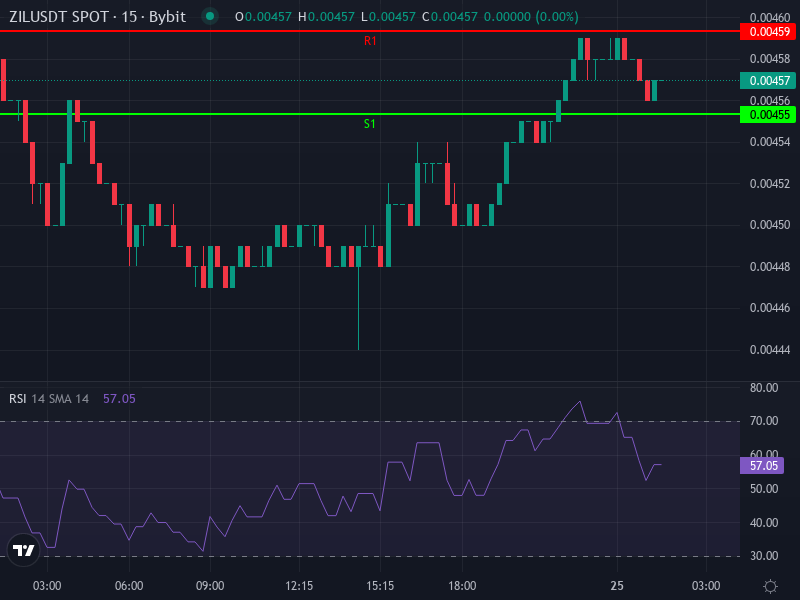
As of writing, ZIL is trading around $0.00456887, up a tiny 0.17% over the past day. Not exactly fireworks. Looking at the 4-hour chart, both the Simple Moving Average (SMA) and Exponential Moving Average (EMA) sit just above current price at roughly $0.00458–$0.00459. That’s your first ceiling—if ZIL can’t push through those levels, it’s probably not going anywhere fast.
The Relative Strength Index (RSI) is hovering near 48.9, which is about as neutral as it gets. Not oversold, not overbought, just… there. Meanwhile, the MACD indicator shows a slight bearish tilt—the MACD line is creeping below its signal line with a small negative histogram. Nothing dramatic, but it suggests mild selling pressure rather than buying enthusiasm.
Daily pivot levels give us a roadmap: support sits at $0.00455 (S1), $0.00453 (S2), and $0.00451 (S3). Resistance levels start at $0.00459 (R1) and climb to $0.00463 (R3). The broader daily momentum indicator (ROCP) is deeply negative, confirming that the multi-day trend has been down, even if the last few hours have been calm.
Key Levels to Watch
The $0.00458–$0.00460 zone is where ZIL keeps bumping its head. If buyers can push through and hold above that resistance with decent volume, we could see a move toward $0.00465, then $0.00470, maybe even a stretch toward $0.00480 if momentum really picks up. That would need confirmation though—rising volume, MACD turning positive, and RSI climbing above 60.
On the flip side, if resistance holds and sellers get aggressive, expect a retest of $0.00455 and possibly $0.00450. Breaking below $0.00450 could accelerate things downward fast, potentially taking us to $0.00430 or lower. The support structure isn’t particularly strong, so once it cracks, it tends to crack quickly.
Right now, ZIL is stuck in the middle—not quite breaking out, not quite breaking down. Classic consolidation territory. Without a catalyst, this could drag on for days or even weeks.
What Could Move the Needle
Positive triggers would include major partnership announcements, especially with traditional finance or regulated platforms. If Zilliqa can showcase real-world adoption of its tokenized assets or compliance tools, that could shift sentiment. Improved staking rewards or successful cross-chain integrations would help too.
On the risk side, broader crypto market weakness—whether from regulatory crackdowns, rising interest rates, or just general risk-off mood—could drag ZIL down with it. Low trading volume is already a concern; if that continues, even small sell orders can push price around. And of course, any security issues with bridges or smart contracts would be a disaster.
Where ZIL Might Be Heading
Let’s talk scenarios. Over the next few weeks, two paths look most likely:
Bullish case: ZIL breaks cleanly above $0.00460 with good volume behind it. That opens the door to $0.00470 first, then $0.00480 if the momentum holds. You’d want to see RSI pushing into the 55–60 range, MACD histogram turning green, and those moving averages flipping from resistance to support. If Zilliqa drops some good news—a big partnership, a major dApp launch, or proof that institutions are actually using the new protocol—this could happen.
Bearish case: Resistance holds firm at $0.00458–$0.00460, and buyers lose interest. Price drifts lower to test $0.00455, then $0.00450. If that floor breaks, we’re looking at $0.00430 pretty quickly, maybe lower. This becomes more likely if the broader crypto market stays weak, volume remains thin, and no positive catalysts emerge. The current MACD setup and negative daily momentum support this scenario at the moment.
If you forced me to pick, I’d say the path of least resistance right now is slightly downward or sideways. The technicals don’t show strong buying pressure, and the fundamentals haven’t translated into price action yet. That said, the risk/reward could be interesting for patient accumulation if you believe in the Zilliqa 2.0 vision—just don’t expect fireworks tomorrow.
The Bottom Line
Zilliqa’s doing the right things on the tech side. The upgrade is real, the partnerships are growing, and the focus on compliance and institutional use cases makes sense in 2025. But the market doesn’t care about potential—it cares about results and momentum. Right now, ZIL has neither.
For traders, this is a wait-and-see setup. Watch for a clean break above resistance or below support before committing. For longer-term holders who believe in the protocol, current levels might look attractive, especially if we get that dip toward $0.00430–$0.00450. Just manage your risk and don’t expect a quick turnaround without a catalyst.