
Current State & Market Context
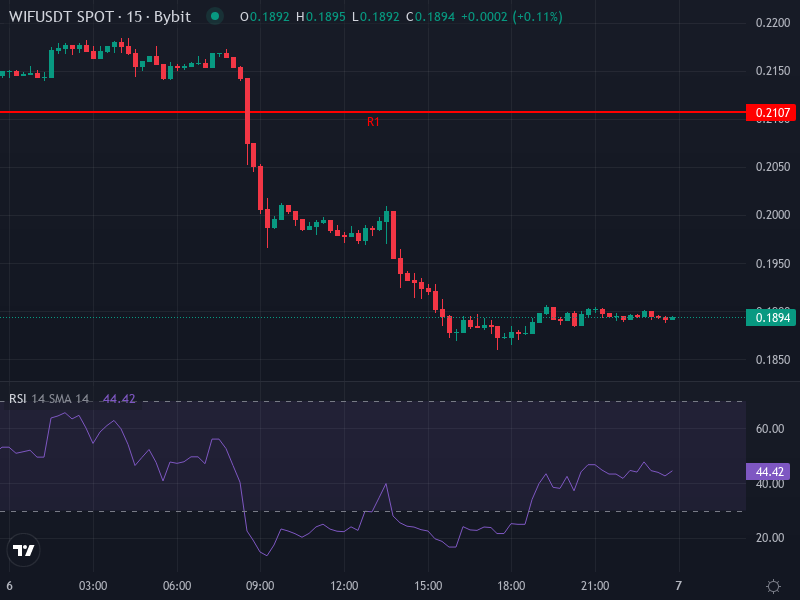
Dogwifhat has taken a beating lately, sitting around $0.1895 after dropping roughly 11.68% in the past 24 hours. The selling pressure is intense, and the technicals aren’t pretty. Looking at the 4-hour chart, the RSI is hovering around 36.34—well below the neutral 50 mark and edging closer to oversold territory. That tells us momentum is still favoring the bears.
The MACD paints a similar picture. The MACD line sits at –0.00207, the signal line at +0.00123, with a negative histogram around –0.00330. Translation? Weak momentum and continued divergence. To make matters worse, both the 4-hour SMA (around $0.2049) and EMA (near $0.20446) are sitting above the current price. WIF is in a short-term downtrend, and reclaiming those moving averages as support rather than resistance is going to be an uphill battle.
When we zoom out to the daily pivot analysis, the picture becomes clearer. The central pivot sits near $0.19833, with resistance levels stacking up at R1 around $0.21067, R2 at $0.23133, and R3 near $0.24367. On the downside, support levels stretch down to S1 at roughly $0.17767, S2 around $0.16533, and S3 down at $0.14467. The rate of change today is –2.06%, suggesting this isn’t just a quick dip—it’s a sustained slide.
It’s worth noting that not too long ago, when WIF was trading between $1.00 and $1.30, analysts were highlighting bullish wedge and triangle breakouts with strong volume surges. Some even threw out forecasts targeting $2 to $5. But those days feel like ancient history now. Declining sentiment in the meme-coin sector, weak demand, and broader crypto headwinds have completely reversed those setups. Those lofty price targets would require a massive shift in trend, volume, and overall market sentiment to even be remotely realistic again.
Technical Forecast & Potential Scenarios
So where does WIF go from here? Based on what we’re seeing in the charts and indicators, there are three realistic scenarios worth considering.
Scenario A: Bearish Continuation Toward Strong Support
If WIF can’t reclaim the 4-hour SMA/EMA zone around $0.2045–$0.2050, and the RSI stays under 40, we’re probably headed lower. First stop would likely be support around $0.1777 (S1). If selling accelerates, $0.1653 (S2) comes into play. A break below $0.1447 (S3) would signal serious trouble and could open the door to even deeper lows. Watch for a continued negative MACD histogram and price remaining below the moving averages—those are your red flags. If you’re trading this scenario, keep your stop-losses tight because the risk–reward ratio isn’t great.
Scenario B: Consolidation and Range-Bound Trading
There’s a chance WIF finds its footing and settles into a range between the central pivot ($0.1983) and S1 ($0.1777). In this scenario, we’d see price oscillating as traders test these levels. A bounce from the $0.1777–$0.180 support zone could push price back toward the pivot or even R1 around $0.2107. But here’s the catch—those 4-hour moving averages will act as resistance. Without a significant increase in buying volume, any bounce is likely to be shallow and get rejected near the $0.210-$0.220 range. Think of it as a test rather than a reversal.
Scenario C: Bullish Reversal—What Needs to Happen
For the bulls to really take control, WIF needs to close above the 4-hour SMA/EMA zone around $0.2045-$0.2050 with strong, convincing volume. From there, a push past R1 ($0.2107) would open the door to R2 ($0.2313) and potentially R3 ($0.2437)—but that assumes the broader crypto market cooperates. We’d need to see the MACD cross upward, RSI climbing toward or above 50, and ideally some longer-term bullish crossovers on the daily or weekly charts. Without these confirmations, any upward move risks being sold into resistance by traders looking to exit.
Interpreting Indicators & Strategy Guidance
The technical picture right now is overwhelmingly bearish. Platforms like TipRanks are labeling WIF as a “Sell,” which stands in stark contrast to the bullish calls from just weeks or months ago. Moving averages across multiple timeframes are bearish, the MACD is negative, and while the RSI at 36.34 shows weak momentum, it hasn’t quite reached extreme oversold levels where bounce risk increases. That could change if we see another leg down.
The pivot levels give us useful roadmaps for entries and exits, but given the heightened volatility and rapid price depreciation we’ve seen lately, risk management is absolutely critical. If you’re thinking about going long, wait for confirmation—price needs to close above the SMA/EMA with real volume, and you want to see that MACD crossover. Don’t try to catch a falling knife. For those already short, support zones near S1 or S2 are logical profit-taking areas, with stops above the pivot or R1. And if you’re a holder? It might be time to consider preserving capital rather than hoping for a speculative bounce, unless the broader market shows signs of improvement.
Key Levels to Watch
• Support: $0.178 (S1), $0.165 (S2), major support at $0.145 (S3)
• Resistance: $0.205 (4-hour moving average zone), pivot at $0.198, R1 at $0.211, R2 at $0.231, R3 at $0.244 if trends reverse