
Where JASMY Stands Right Now
JasmyCoin has been stuck in a tough spot lately. Early 2026 saw chart patterns like falling wedges and descending triangles forming—the kind of setups that hint at a breakout if the price can punch through resistance. Traders have been watching the $0.0100–$0.0117 zone closely as the key level to beat, while support sits around $0.0075, with stronger backing near $0.0062. If that support cracks, things could get messy fast.
The vibe around JASMY is honestly mixed. On one hand, there’s real progress happening—Layer-2 mainnet work and partnerships with decentralized infrastructure projects are moving forward. On the other hand, the token’s massive supply, murky regulations between Japan and the U.S., and skeptical short sellers keep a lid on enthusiasm. And like every altcoin, JASMY’s fate is tied to what Bitcoin does and whether money rotates into smaller coins.
What the Indicators Show
Looking at the 4-hour chart, the technical picture is pretty neutral. The RSI sits around 46.5—not hot, not cold, just stuck in the middle. The MACD histogram shows a tiny bullish crossover, with the MACD line barely above its signal line, suggesting weak upward momentum trying to build. But here’s the catch: price is trading below both the 4-hour Simple Moving Average (about $0.0054297) and the Exponential Moving Average (around $0.0054190). That’s a red flag for short-term weakness.
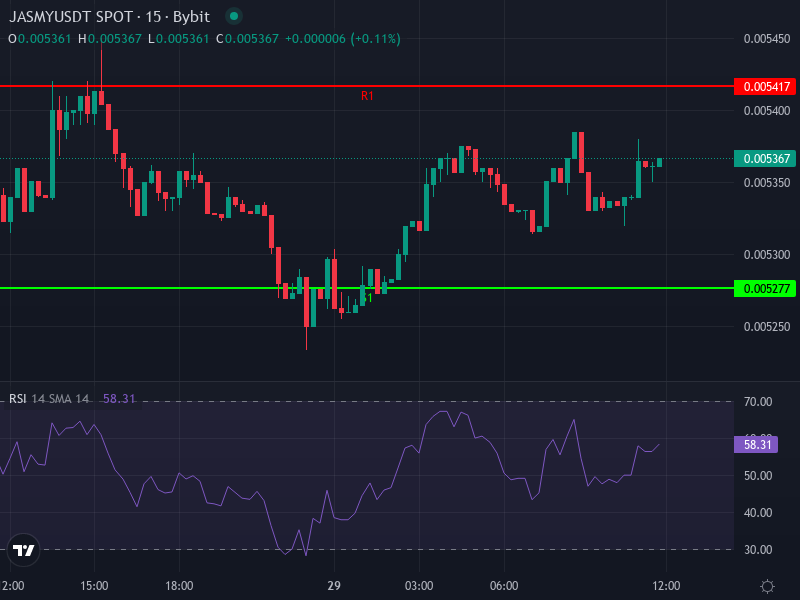
Zoom out to the daily timeframe and it doesn’t get much prettier. Resistance levels stack up between roughly $0.0054167 and $0.0055567, while support zones stretch down to around $0.0051367. The daily rate of change is negative at about -5.13%, confirming recent bearish pressure. Right now, JASMY is trading in no man’s land—below resistance but not quite testing support.
Three Ways This Could Play Out
If Bulls Take Control
JASMY needs to climb back above those 4-hour averages near $0.0054 and hold there. If it does, momentum could build toward the daily resistance around $0.0055567. Break that ceiling and we’re looking at $0.0057-$0.0058, possibly higher if volume picks up. The real prize sits way up at $0.0100-$0.0117—that medium-term resistance wall. Crack through there and suddenly $0.015-$0.02 doesn’t seem crazy. That’s where the falling wedge pattern would really pay off.
If Bears Keep Pushing
If JASMY can’t defend its short-term averages and slips below the immediate support at $0.0052767, we’re probably headed down to $0.0051933, maybe even $0.0051367. Broader market weakness would make this worse. Fall below $0.0051 and panic selling could kick in, potentially dragging the price toward $0.0050 or lower. The really scary level is that $0.0062 support from the higher timeframes—lose that and it’s anyone’s guess where the bottom is.
If Nothing Happens
Given the RSI hovering near neutral and price wedged between key levels, JASMY might just drift sideways for a while. Call it $0.0052-$0.0053 on the low end and $0.0055-$0.0056 on the high end. This kind of choppy, low-volatility trading could drag on until something changes—a new partnership, regulatory clarity, a Bitcoin rally, something that gives traders a reason to commit one way or the other. Sometimes the chart just needs to rest before making its next move.